1
Open the Google Docs document
Navigate to your Google Docs document to begin the process of inserting a new chart.
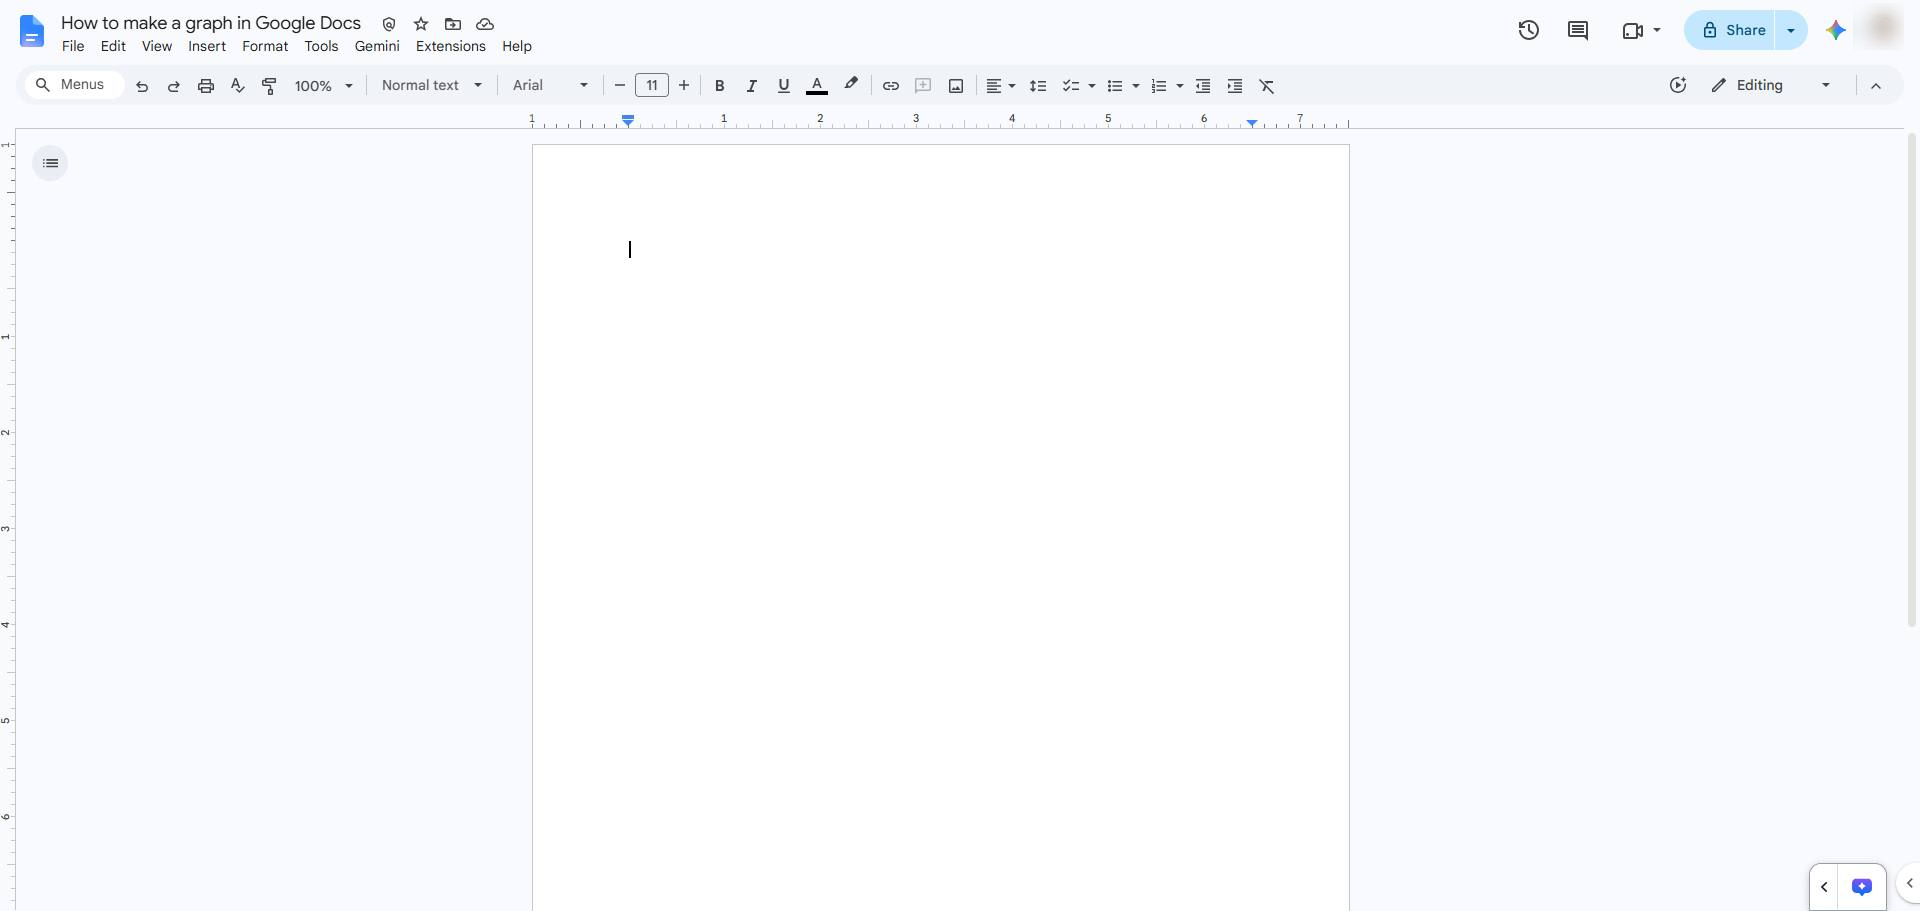

Learn how to insert and configure a bar chart in Google Docs. This step-by-step guide walks you through using the Insert menu to add a chart to your document.
Navigate to your Google Docs document to begin the process of inserting a new chart.
Click inside the blank document page to place your text cursor where you want the graph.
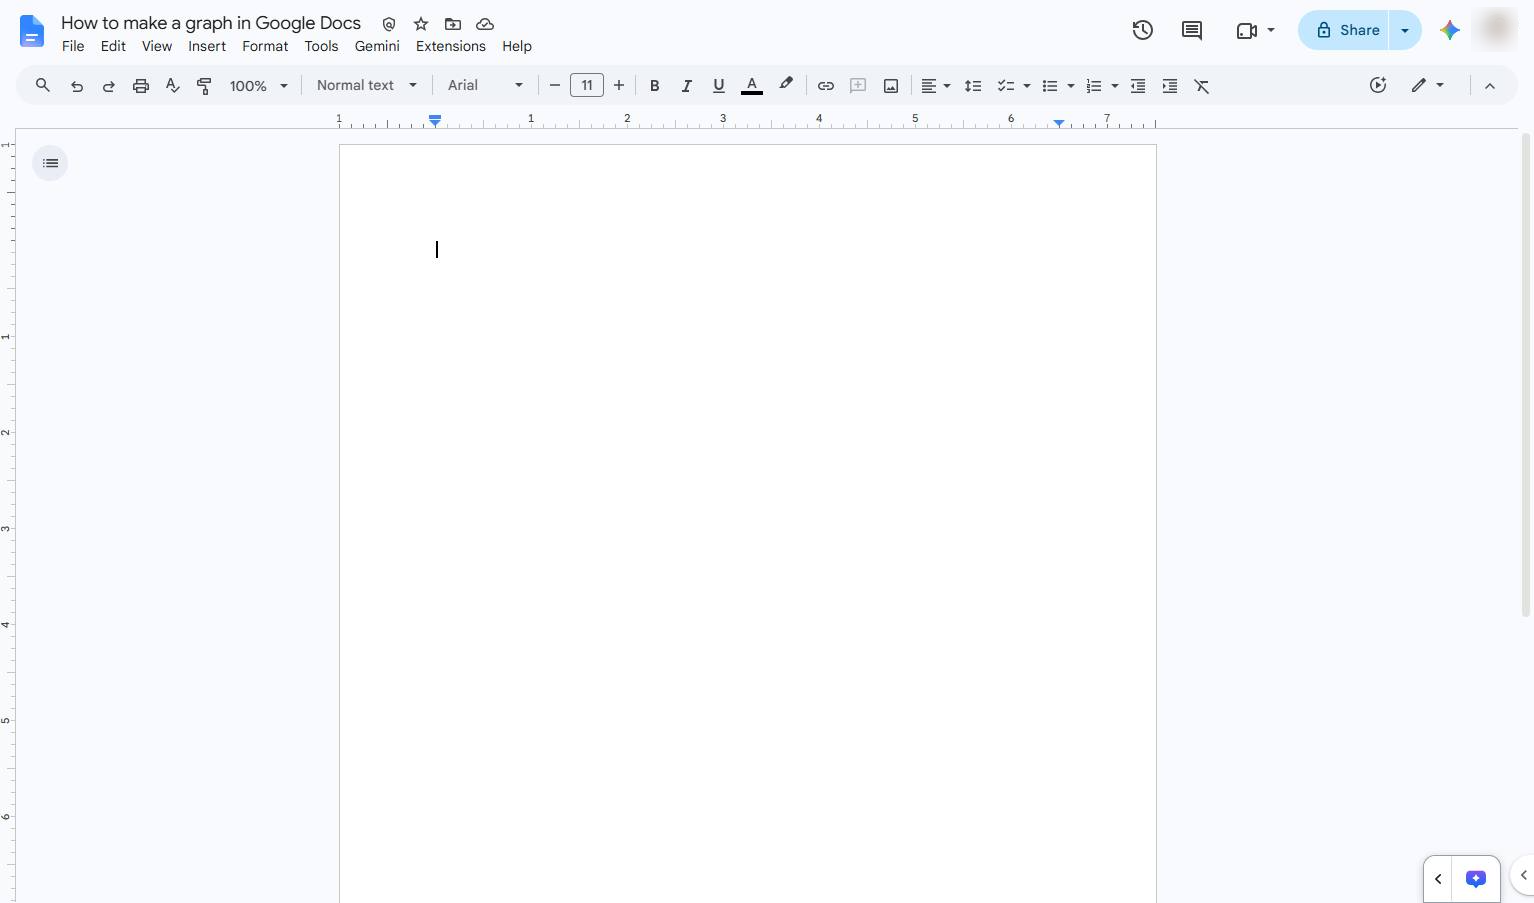
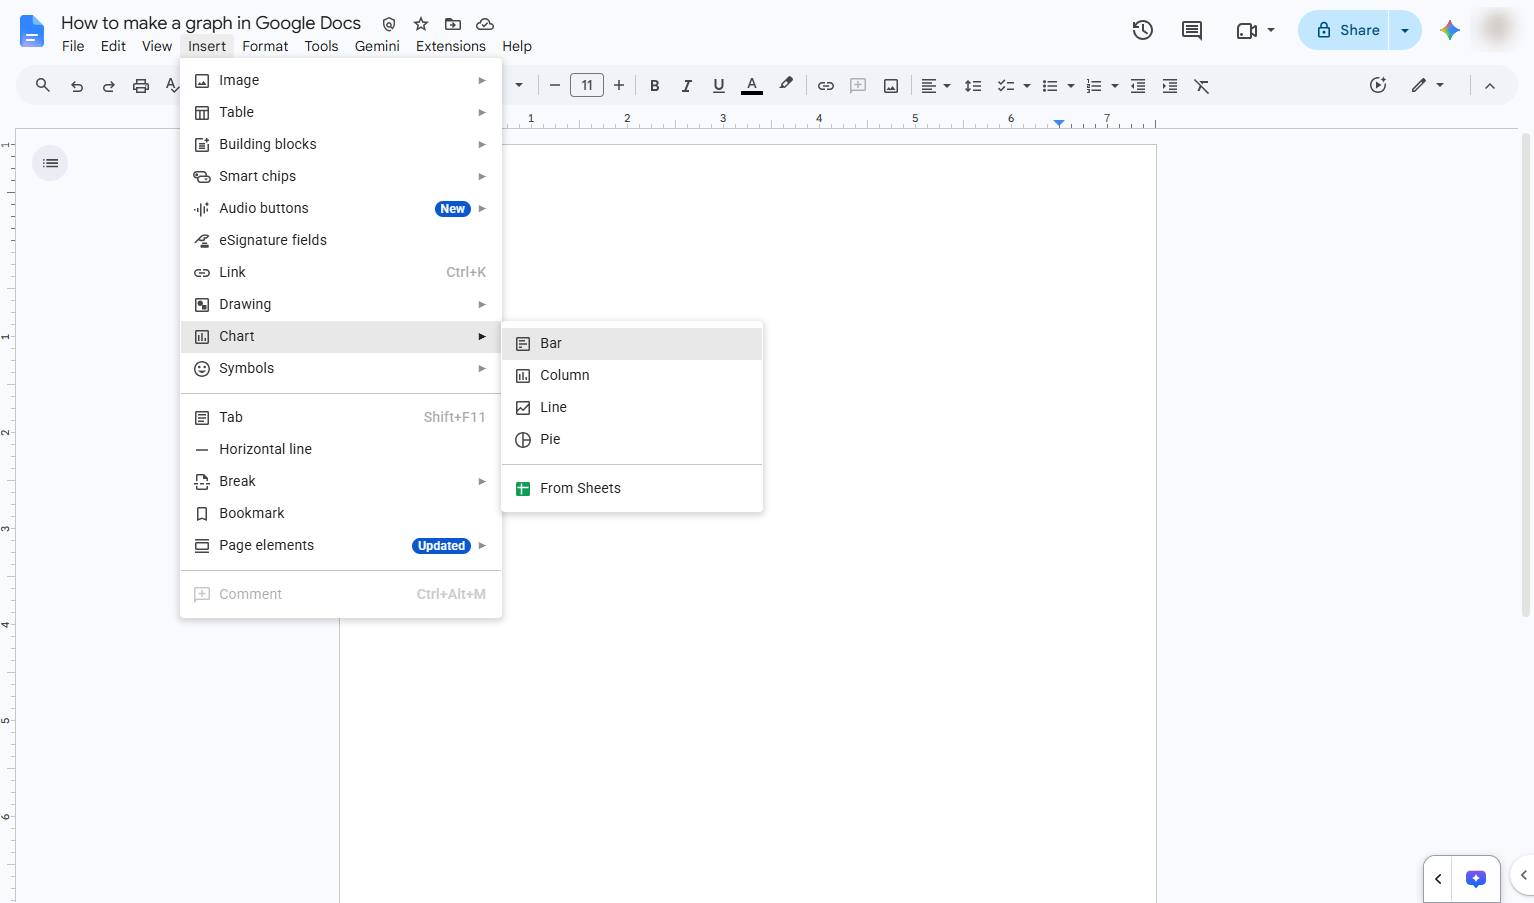
Click the Insert menu in the top toolbar to open the dropdown of insertable items.
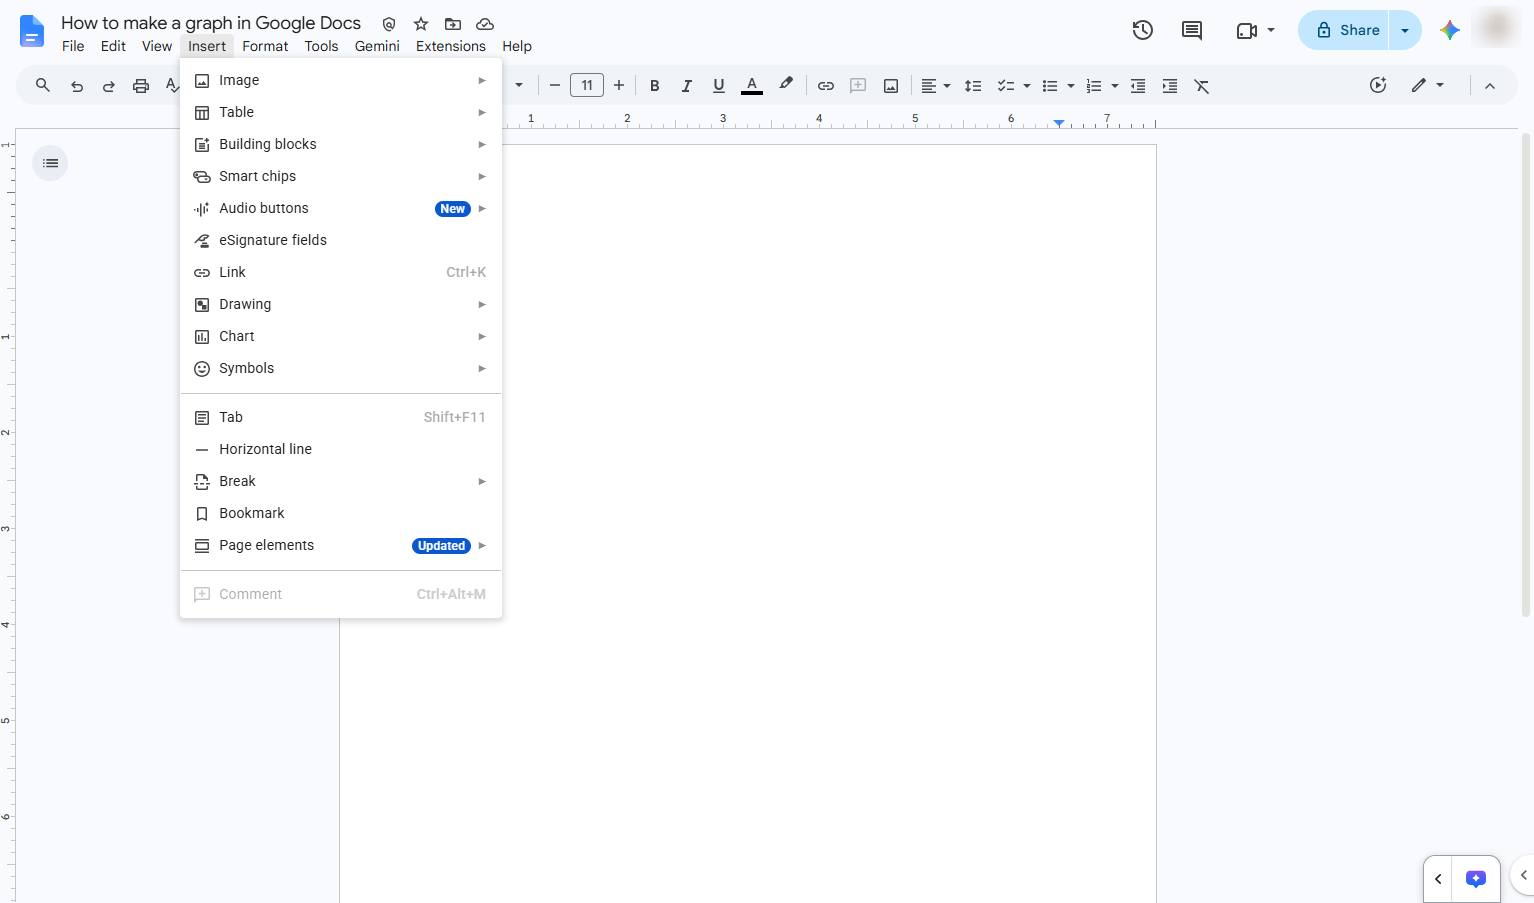
Click the "Chart" option in the Insert dropdown menu to view the available chart types.
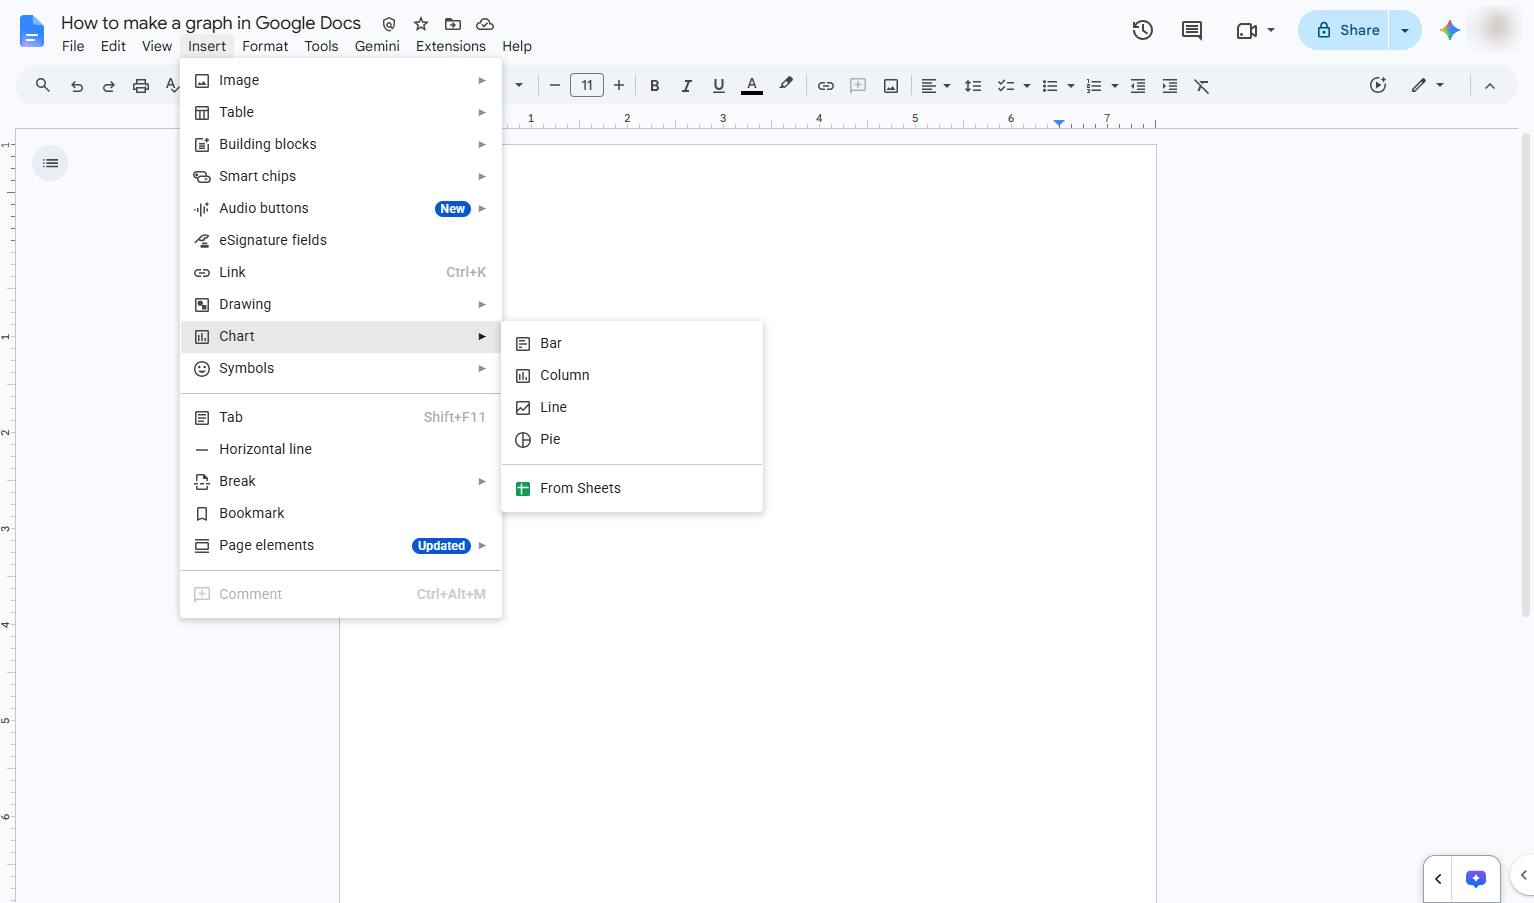
Click the "Bar" option in the Chart sub-menu to insert a bar chart into your document.
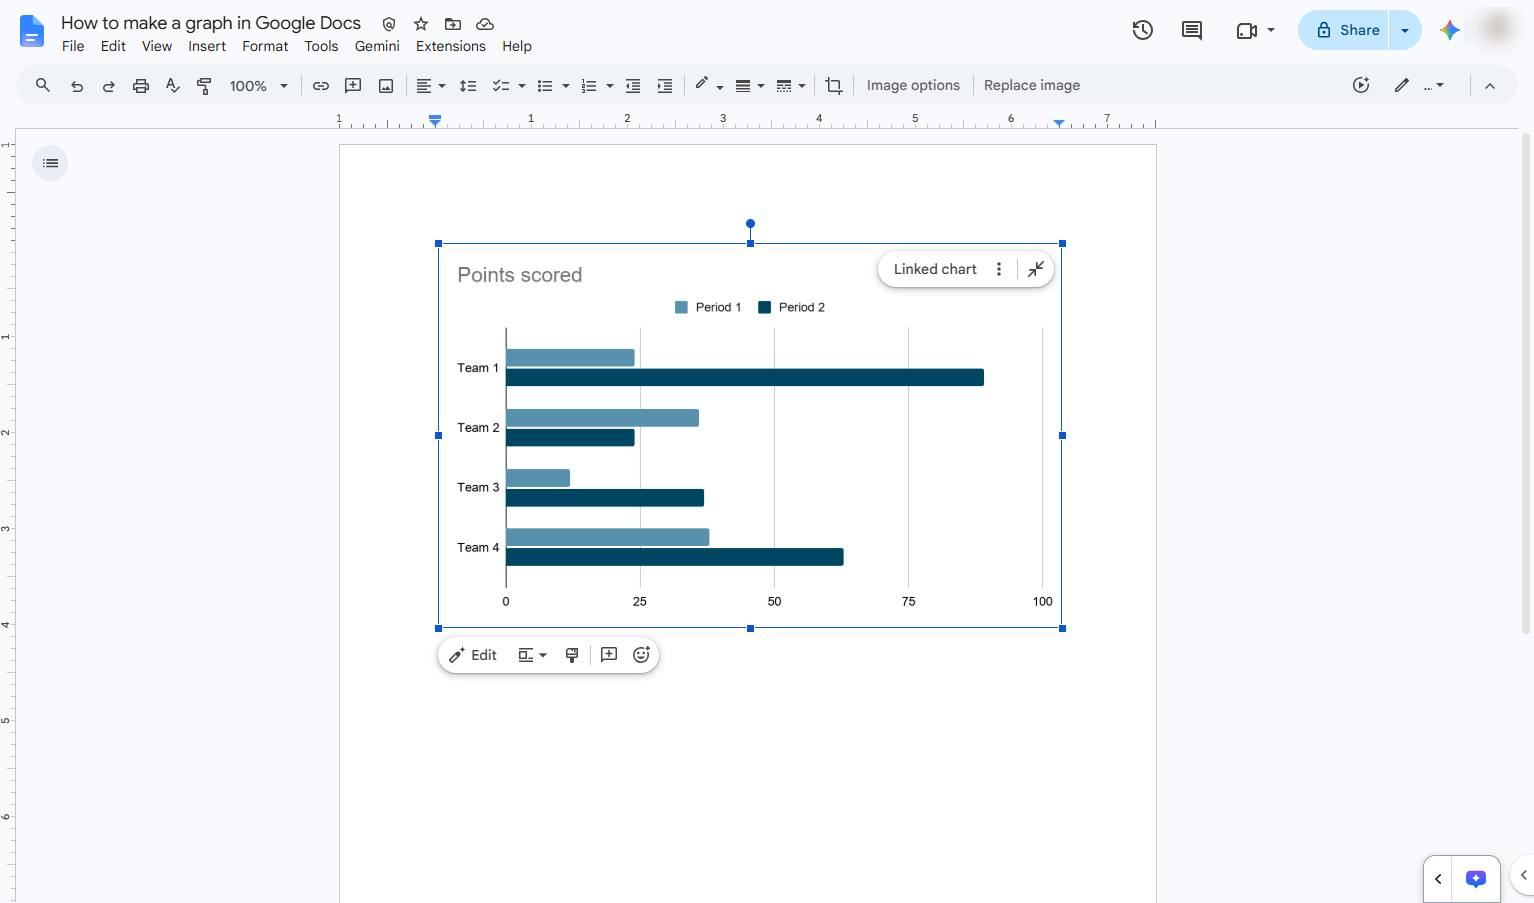
Click on the inserted chart in the document to select it and reveal its options to modify data.
Duplicate this template, swap in your own screens, and share it with your team. Free to start — no credit card.
Fill out the form and we'll get back to you as soon as possible.
Tell us about your team and we'll find the right plan together.